1. Data Preprocessing
Processing Match Results
The initial step in our analysis is to process match results from the T20 World Cup. We start by reading the match results data from a JSON file. This data contains summaries of each match, including team names and scores.
To make the data more accessible for analysis, we convert it into a DataFrame and rename key columns. We also create a dictionary that maps unique team matchups to their corresponding match IDs. This mapping helps link the match data with other datasets.
The cleaned match results are then saved to a CSV file, which will be used in subsequent analysis stages.
Processing Batting Summary
Next, we process the batting summary data, which includes detailed records of each player's performance in various matches. The data is read from another JSON file and extended into a comprehensive DataFrame.
We enhance this data by adding a column to indicate whether a player was out or not. The match IDs are mapped using the previously created dictionary, linking batting performances with specific matches. Special characters in player names are cleaned to ensure data consistency.
The processed batting summary is then exported to a CSV file, ready for further analysis.
Processing Bowling Summary
Similarly, we handle the bowling summary data, which details the performance of bowlers in the matches. This data is loaded from a JSON file and converted into a DataFrame. The match IDs are linked to the bowling records using the same dictionary.
This cleaned bowling data is saved to a CSV file, which will be used to analyze bowlers' performance metrics.
Processing Player Information
The final step in preprocessing is to manage player information. This dataset contains details about each player, including their names and teams. We clean up any unusual characters from the player names to ensure accuracy.
The player information is then saved to a CSV file, which includes key details but excludes images
2. Data Model
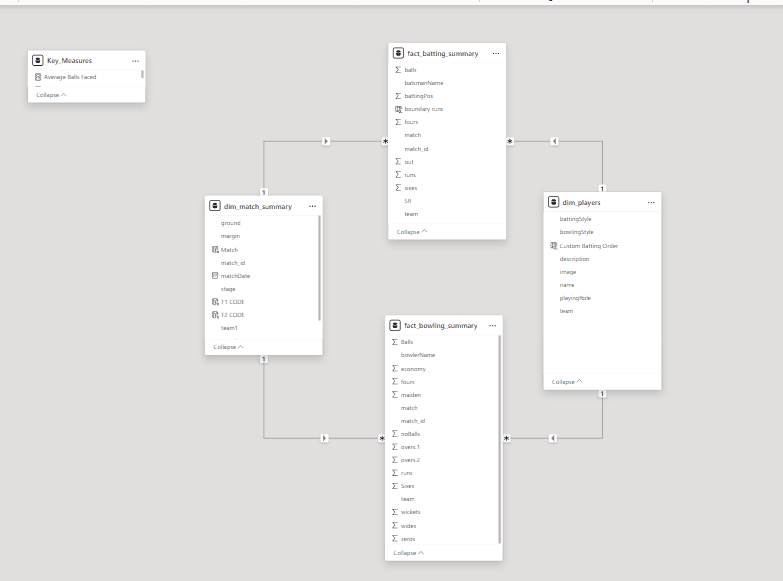
The model includes several tables with relationships established between them, supporting comprehensive data analysis for cricket match results, player performances, and team statistics. Here’s a breakdown of the tables and their connections:
dim_match_summary:
Contains details about each match, including
ground,margin,match,matchDate, andstage.The primary key is
match_id, which is connected to both the batting and bowling summary tables.This table is central to the model, linking individual player performances with their respective matches.
dim_players:
Stores information about players, such as
name,team,battingStyle, andbowlingStyle.The key
namelinks this table to both the fact_batting_summary and fact_bowling_summary tables, making it possible to view player-specific batting and bowling statistics.
fact_batting_summary:
Contains detailed batting data for each player, including
balls,fours,sixes,runs, andout.The
match_idconnects to dim_match_summary, andbatsmanNamelinks to dim_players to associate the performance with the specific player and match.
fact_bowling_summary:
Stores bowling performance data such as
balls,wickets,economy,maidens, andovers.The
match_idconnects to dim_match_summary, andbowlerNamelinks to dim_players to associate each bowler's performance with specific matches.
Key_Measures:
This table appears to contain a calculated measure, such as the average balls faced by a batsman, which is a derived metric used for visualizations and further analysis.
Relationships:
The dim_match_summary table is connected to both the fact_batting_summary and fact_bowling_summary tables through
match_id, allowing the system to pull match-specific batting and bowling data.The dim_players table connects to both fact_batting_summary and fact_bowling_summary via
batsmanNameandbowlerName, enabling player-specific data analysis.
3. Dashboard Development in Power BI
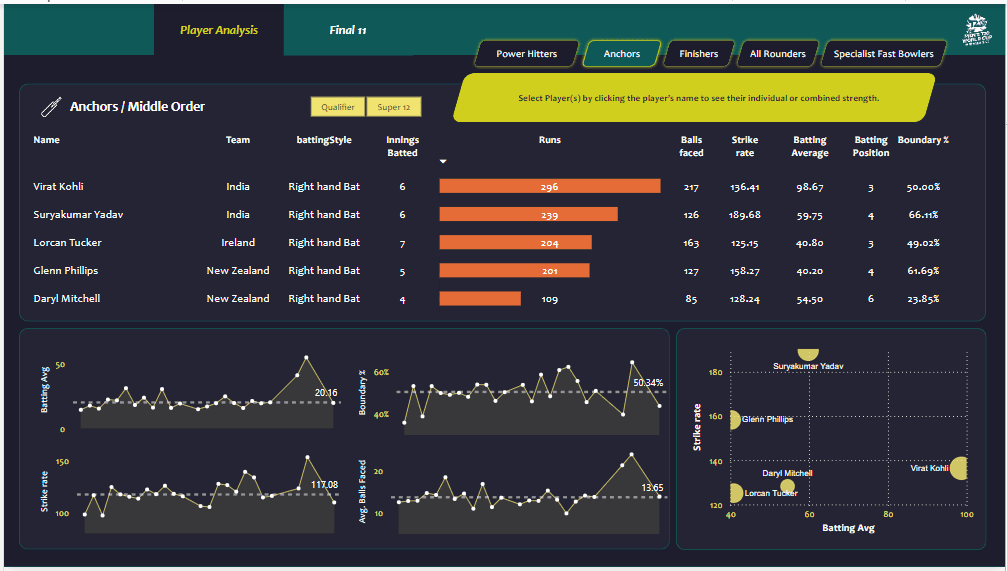
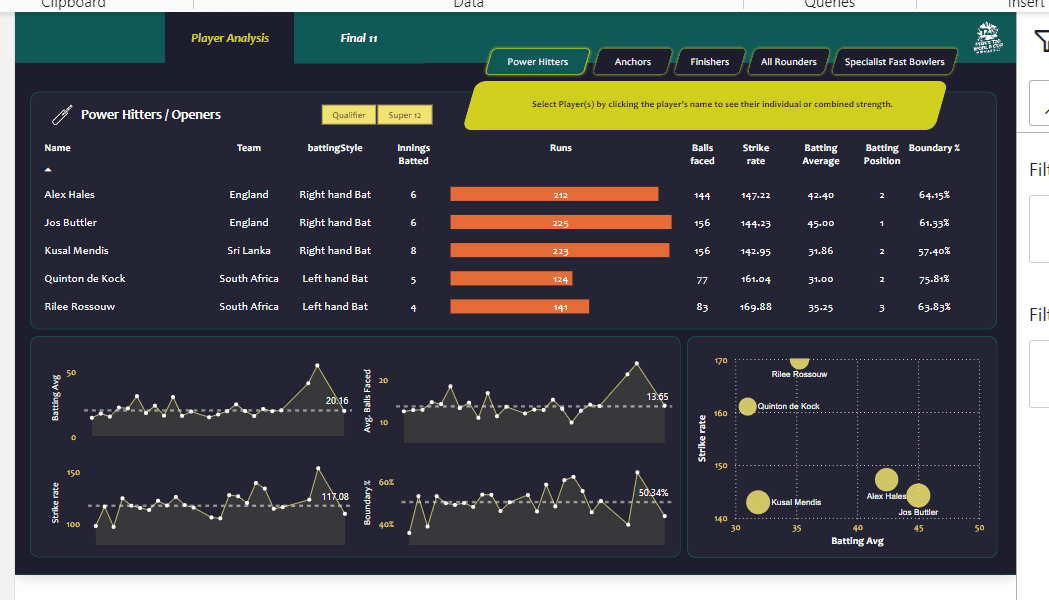
With the cleaned and processed data ready, we move on to developing the dashboard in Power BI. The dashboard provides interactive visualizations that offer insights into various aspects of the T20 World Cup:
Match Results: Visualize match outcomes, scores, and team performance with interactive charts.
Top Batsmen and Bowlers: Display rankings and performance statistics of top players based on runs scored and wickets taken.
Player Profiles: Showcase individual player stats, including their performance in different matches.
Win/Loss Trends: Analyze trends in match results, showing wins and losses across teams and dates.
The Power BI dashboard allows users to interact with the data, filter by different criteria, and gain a comprehensive view of the T20 World Cup's cricket matches.
GITHUB LINK:: https://github.com/ibtihajjutt/T20-World-Cup-Data-Analysis-Python-PowerBI
Conclusion
This project successfully transforms raw cricket data into meaningful insights. By preprocessing the data and developing an interactive Power BI dashboard, we provide a clear and engaging way to explore match results, player performances, and overall tournament trends.