Designed for Personal portfolios , it seamlessly blends minimalist aesthetics with dynamic animations. Showcase your work in style with a sleek interface that flawlessly adapts to any device.
Objective
The goal of this practice project was to explore how data analysis and forecasting could be applied to improve business decision-making. By analyzing simulated sales trends and creating forecasts, I aimed to demonstrate how data can provide clear insights to drive business growth.
Dashboard Creation
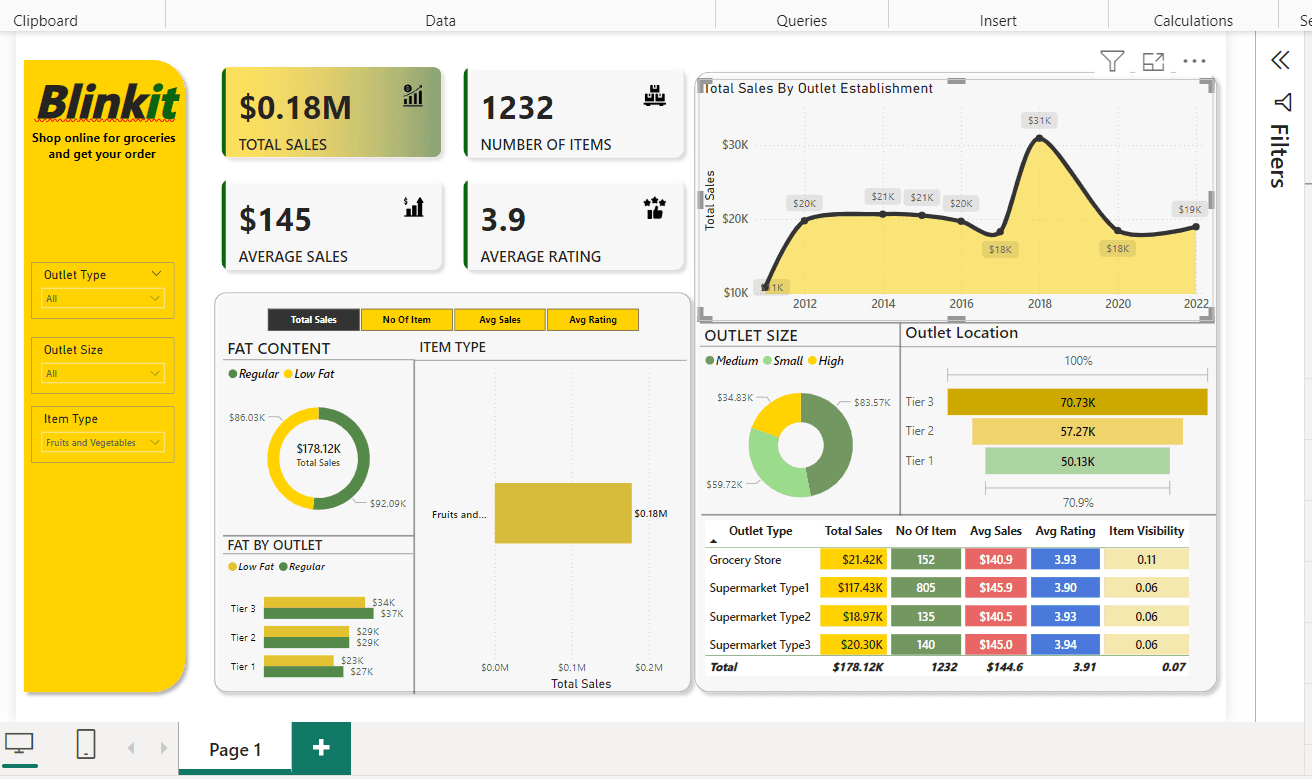
I have built a beautiful and easy-to-navigate dashboard using Power BI. With interactive visualizations and filters, the dashboard empowers users to dig into the data at different levels and uncover insights effortlessly. The focus was on highlighting the most important KPIs, making it simple for anyone to explore and make informed decisions.
Data Analysis
Balancing aesthetic appeal with functionality can be difficult, but BrightSites excels in this area. The template’s sticky scrolling and slideshow features make navigation intuitive and engaging, allowing your audience to explore your work with ease. Whether they are browsing through a detailed case study or a dynamic project showcase, BrightSites ensures a seamless experience that keeps users engaged and focused on your content.
User-Centric Design
Behind every successful business is a wealth of data. Our deep-dive analysis revealed critical insights into Blinket’s sales strategies, showing where they were succeeding and where there was room for improvement. Through clear charts and visualizations, Blinket’s team could easily see how their decisions were impacting their bottom line.
Actionable Insights
The end result? Actionable insights that Blinket’s leadership can use to fine-tune their sales strategies, improve efficiency, and deliver better customer satisfaction. We didn’t just provide data; we provided a roadmap to success.