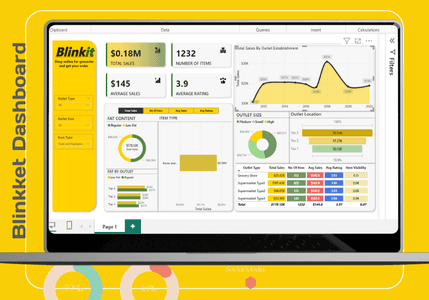
This "Super Store Sales Data Analysis" project showcases a dynamic and insightful approach to sales forecasting. With a sleek design and a seamless blend of analytics and visualizations, it's perfect for businesses looking to leverage data for growth and operational efficiency.

My Approach
The Super Store Sales Analysis project is meticulously designed to help businesses unlock actionable insights from their data. my approach emphasizes clarity and impact, focusing on delivering a visually engaging experience while providing critical sales trends and forecasts. The project is tailored to meet the needs of businesses aiming to optimize their sales strategies and improve decision-making.
Dashboard Creation
A user-friendly and visually appealing dashboard was designed to display Key Performance Indicators (KPIs) related to sales performance. Interactive visualizations and filtering capabilities were implemented, enabling users to explore sales data at different granular levels.
Data Analysis
This project dives into the analysis of sales data, providing insights on the effectiveness of sales strategies. Various visualization techniques, including bar charts and line graphs, were used to showcase trends and patterns in the sales data.Sales Forecasting
Utilizing historic data from the superstore, I applied time series analysis techniques to predict sales performance over the next 15 days. This forecasting provides insights into expected sales trends and aids in better inventory and supply chain management.Actionable Insights and Recommendations
The project goes beyond simple analysis, offering actionable insights and recommendations. These insights are designed to support strategic decision-making processes, aligning with the store's goals for growth, operational efficiency, and customer satisfaction.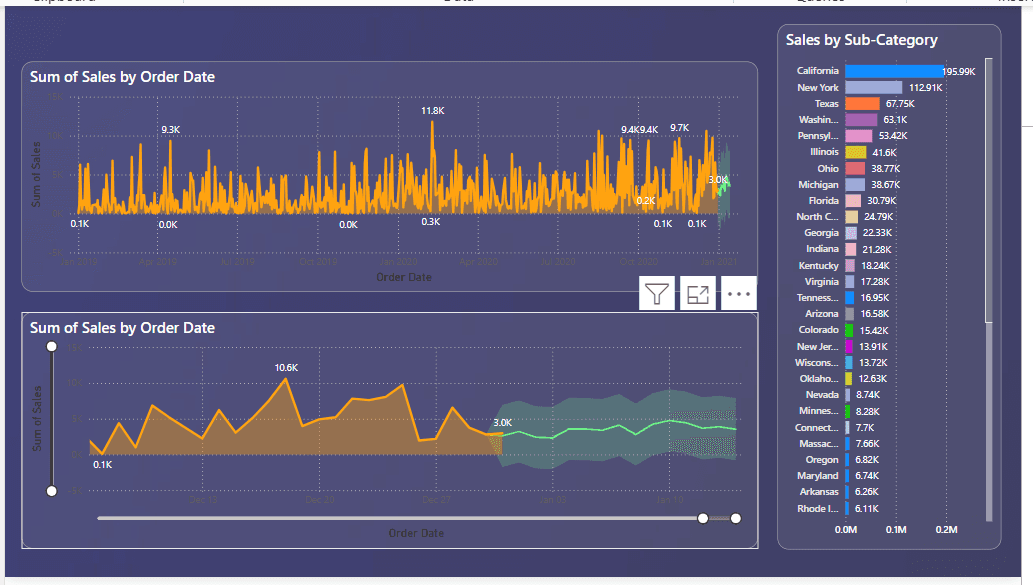
Techniques and Tools
Data Cleaning & Preprocessing: Handling missing data, outliers, and transforming the dataset for analysis.
Exploratory Data Analysis (EDA): Uncovering trends, relationships, and patterns in the data.
Time Series Forecasting: Applied statistical and machine learning models to predict future sales.
Visualization: Created interactive dashboards and visual reports using tools like Tableau and Matplotlib.
Outcomes
A fully interactive dashboard that allows stakeholders to drill down into specific time frames, regions, or product categories.
Sales forecast results that help the superstore plan for future stock requirements and promotions.
Insights on peak sales hours and customer preferences, enabling better staffing and marketing strategies.
GITHUB LINK:: https://github.com/ibtihajjutt/Super-Store-Sales-Analysis-PowerBI
Conclusion
This project provides an end-to-end analysis of superstore sales, from data preparation to delivering insightful business recommendations. The dashboard and analysis serve as valuable tools for the company to better understand its sales performance and make data-driven decisions for continuous improvement.